

Texas Quail Index 2018 Summary
The end of 2017 had quail enthusiasts across the state of Texas holding their breath. Years 2015 and 2016 had been remarkable for quail with record numbers of birds heard, seen and hunted, and the highest values yet recorded in the Texas Quail Index monitoring program. While 2017 wasn’t a bust by any means, we saw a leveling off of the meteoric rise in quail numbers in many parts of the state. High carryover from the preceding years ensured that there were still plenty of birds around at the start of hunting season, but it felt like our rollercoaster was nearing its apex and preparing to plummet down the other side.
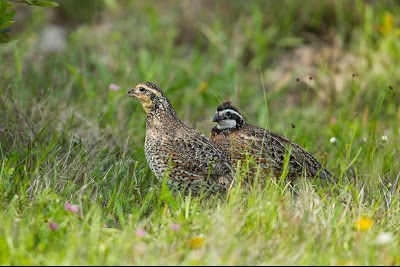
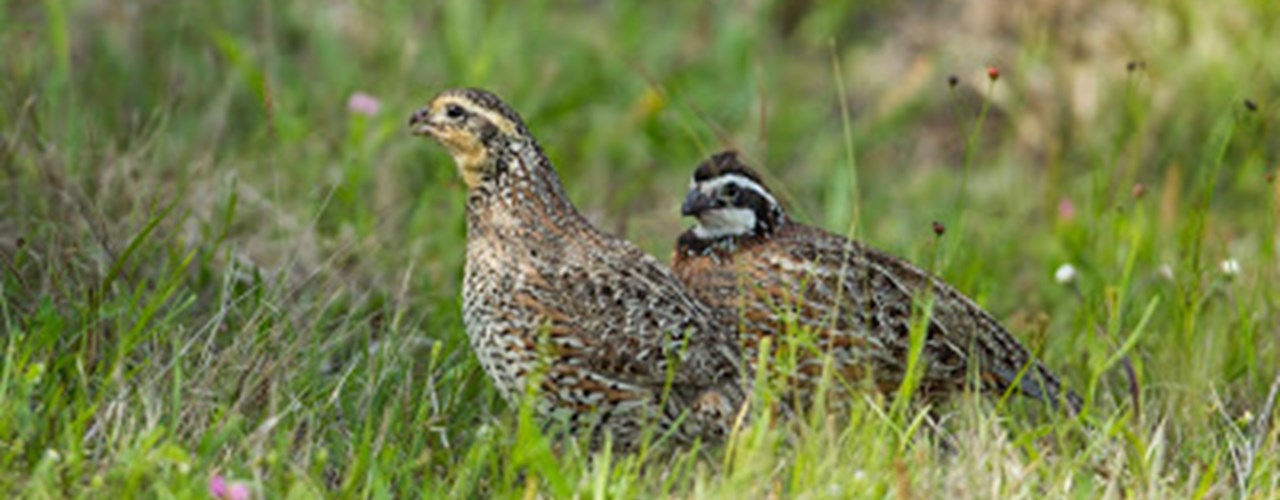
A male and female bobwhite pair. Photo courtesy of TPWD.
By several accounts, that’s exactly what happened. Texas Parks and Wildlife’s longstanding quail monitoring program, which includes 14 years of roadside count data, reports a nearly 80% drop off in bobwhite sightings this year versus last year in the Rolling Plains (average of 26.72 birds seen per route in 2017, 5.43 in 2018). Scaled quail fared worse, with counts falling more than 90% this year in the same ecoregion (average of 3.67 birds seen per route in 2017, 0.30 in 2018). The graphs for each species paint a startling picture of this rise and fall, with peaks representing the recent record highs dropping off starkly to near 2013/14 levels. The Rolling Plains Quail Research Ranch has also reported disappointing trapping numbers and a lack of quail this hunting season.
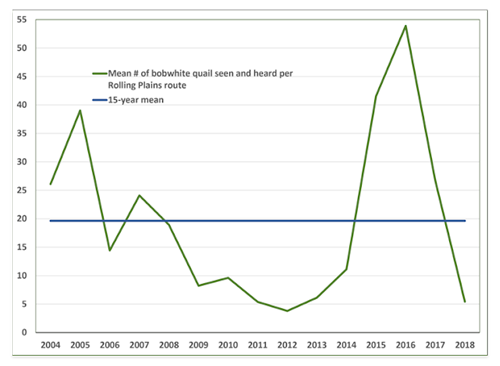
Bobwhite roadside counts in the Rolling Plains dropped starkly this year. Graph from the TPWD 2018-19 Quail Forecast.
Quail Index Roadside Count Data show similar trends. While data collection efforts in some areas were once again hampered by (much-needed) rain, we saw a drop in average bobwhite counts from 1.36 birds per mile in 2017 to 0.38 birds this year. Among cooperators in scaled quail country—namely the Edwards Plateau and Trans Pecos ecoregions—the “blues” appeared to weather the bust better with numbers even increasing slightly from an average of 1.29 birds per mile in 2017 to 1.36 this year. Because our Rolling Plains cooperators report only on bobwhites, we cannot offer any input on the scaled quail decline reported in the Rolling Plains by Texas Parks and Wildlife.
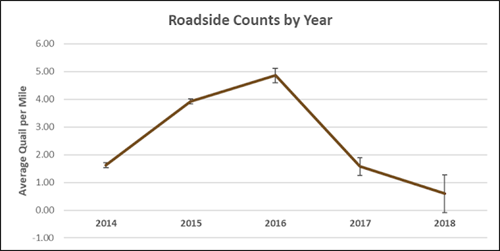
Bobwhite roadside counts in the Rolling Plains dropped starkly this year. Graph from the TPWD 2018-19 Quail Forecast.
Roadside counts are typically conducted in late summer, but the TQI begins monitoring quail populations in the spring (April/May) with call counts. Judging by call count data alone, it seemed like quail populations might have stabilized after all. Counts for both species were about on par with 2017, averaging slightly higher for bobwhites (3.4 roosters per mile marker this year, 3.1 last year) and slightly lower for scaled quail (1.5 this year, 1.8 last year). This is likely attributable to the holdover from the previous year. While some parts of the state, such as the panhandle, were already experiencing severe drought conditions during this time, the dry spell wouldn’t really take its toll on most Texas quail country until the summer—i.e., peak quail breeding season.
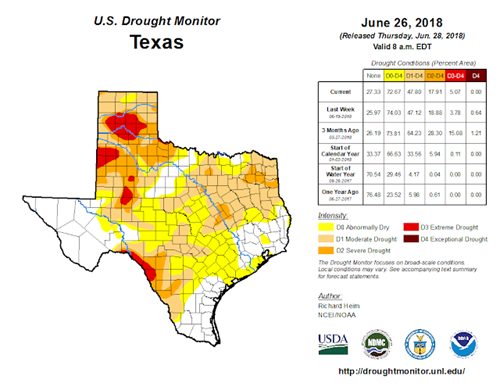
The U.S. Drought Monitor from June 26 shows several parts of the state in moderate to extreme drought.
The disparity between call count and roadside count numbers suggests that quail faced serious challenges over the summer. One of the ways that the Quail Index attempts to gauge breeding season challenges is through the use of “dummy nests”—stand-ins for quail nests, constructed using 3 chicken eggs, which can be monitored to estimate rates of actual nest predation. This year, our dummy nest survival rates were the lowest they’ve ever been for the TQI, averaging only 41%. While it may seem defeatist to mark a <50% success rate as satisfactory, quail nests experience such naturally high rates of predation that anything above 40% is generally considered acceptable. However, the change relative to last year (average dummy nest survival was 49% in 2017) may be worth paying attention to. Some of this might be attributable to human factors, such as differences in volunteers or cooperating properties, but it’s also possible that it’s a symptom of increased predation pressure or reduced habitat quality.
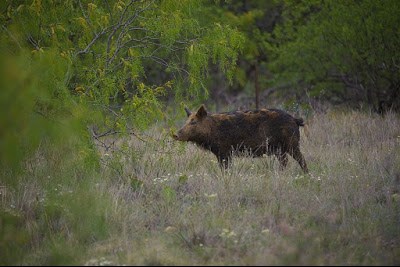
Feral hogs were especially abundant quail predators this year. Photo courtesy of USDA.
The TQI includes protocols for monitoring predators as well, using eggshell evidence from dummy nests and game cameras. In the case of nests, the two most commonly identified predators were raccoons, which have a tendency to tear shells into large chunks, and coyotes, which typically crush shells into tiny fragments. These two together made up more than half of our “candidates of destruction” for dummy nests. Game camera evidence suggests that one nest predator may be underrepresented, however: feral hogs. The number of hogs caught on camera rose dramatically this year (199), more than doubling last year’s count (72) and totaling more than coyotes and raccoons combined (83 and 85, respectively). Overall, we saw more total predators photographed this year, but less species diversity with the feral hogs dominating the counts.
The TQI’s habitat evaluations further clarify why quail may have struggled this summer. These scores have always trended high, with properties rarely falling below the “good” or “excellent” ranges, but our average overall Evaluation Value this year—0.62—was the lowest it’s been over the course of the Index. That score follows precedent and places in the “good” category, but the limiting factors that contribute to it are a departure from the norm. “Limiting factors” are aspects of the habitat that restrict its usability for a species (bobwhite or scaled quail in this case) and nesting cover has almost always been limiting. This year however, the most significant factors were availability of food and diversity of woody cover species, both of which may have been exacerbated by lack of rain.
In short: it looks like we’ve finally hit a bust. Some may find this disheartening after the great resurgence of 2015 and 16, but it’s important to remember that boom and bust cycles are simply how quail populations operate. Ups and downs are normal, and even the most expertly managed, quail-friendly properties will have them. Data collection and continued monitoring are just as important in bust years as they are in boom years, as we learn which conditions produce fewer birds and maintain long-term data sets to detect trends over time.
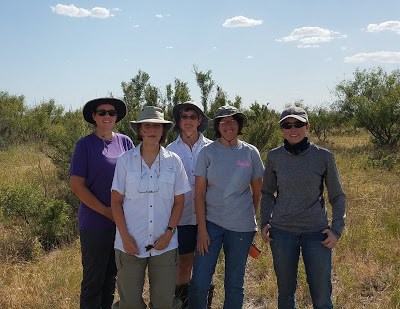
Thank you to the Texas Quail Index cooperators—including volunteers, county extension agents, wildlife biologists and landowners who make that data collection possible!
--
Original story published on Wild Wonderings
--
The Texas A&M Natural Resources Institute grants permission for authors, readers and third parties to reproduce and republish materials from its blogs, publications and online products through permission requests to NRI Communications at nri@tamu.edu. This includes the use of figures, maps, photography and video media. If you have questions about permissions, please contact Brittany Wegner.