

Texas Quail Index 2017 Summary
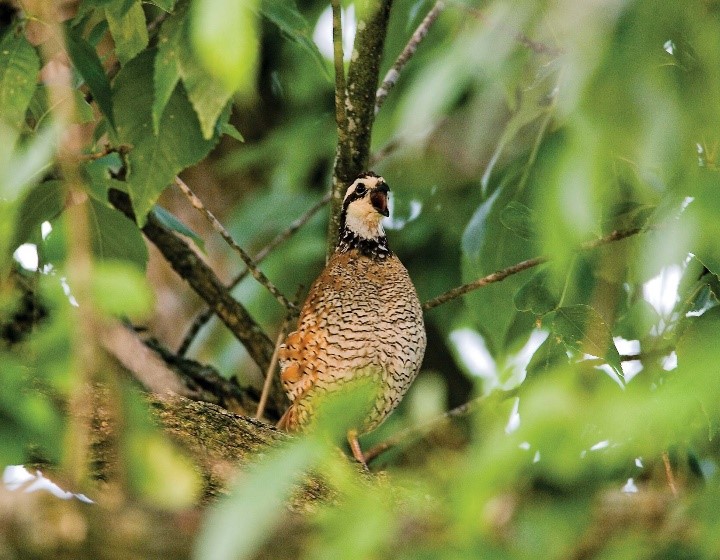

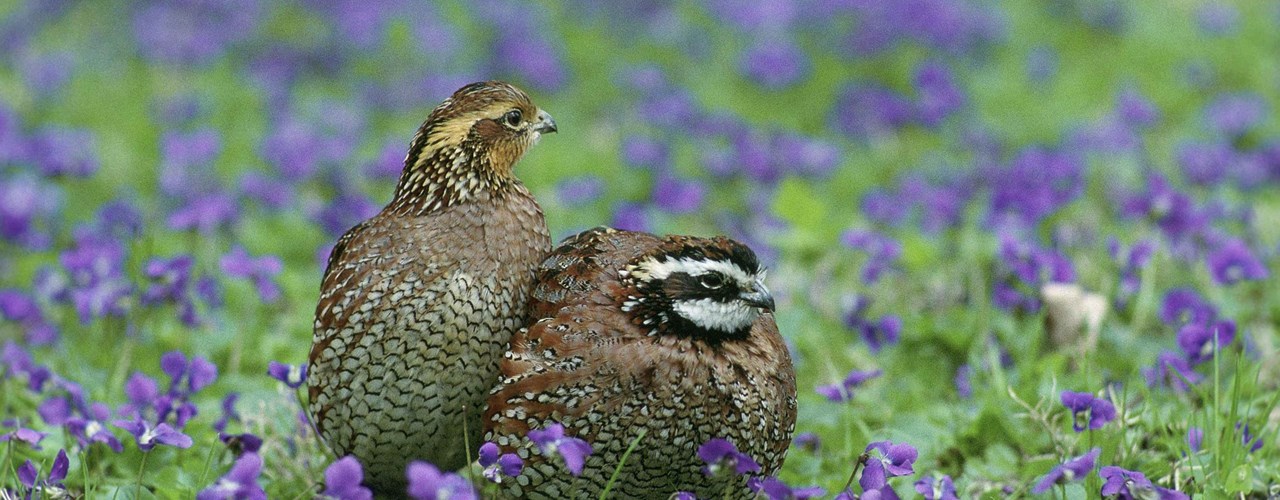
A calling bobwhite rooster. Photo courtesy of Missouri Dept. of Conservation
Spring Call Counts
For bobwhites, this year’s call count results were more or less comparable to last year’s. The statewide average of 3.1 roosters heard per mile marker was nearly identical to the 2016 average (3.2), and the Rolling Plains maintained its title as the ecoregion with the highest call count values, boasting an average of 4.8. This value does reflect a decrease in calling activity for the ecoregion relative to 2016 however, when call counts in the Rolling Plains averaged 6.2 roosters per stop. The Gulf Prairies ecoregion, in contrast, made a substantial comeback this year with a 2.5 average, up from 1.6 in 2016 when flooding impacted populations and interfered with spring data collection.
Scaled (blue) quail proved more variable this year than bobwhites. The statewide average for blues was 1.8 roosters per mile marker, down from 2.6 in 2016. While those values may seem low compared to bobwhites, these are impressive numbers compared to where scaled quail were in 2015 (average: 0.6) and 2014 (average: 0.3). The Edwards Plateau ecoregion had the highest density of calling roosters with an average of 2.3 birds per mile marker.
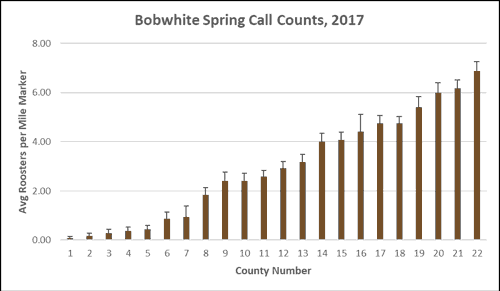
Average number of roosters heard during spring call counts for TQI participating counties.
Dummy Nests
The TQI evaluates nesting success by having cooperators establish “dummy nests”: sets of 3 chicken eggs placed in a quail-appropriate nesting substrate such as a bunch grass clump, low-growing shrub, or prickly pear cactus. This year’s dummy nest survival rate was 49%, up from 45% in 2016. A 50/50 chance of nest success may seem like a poor survival rate, especially since the entire nesting process, from site selection to hatching, requires more than a month and substantial energy, but nest success rates as low as 40% are not out of the ordinary for quail. A survival rate of 49% after 4 weeks in the field can be considered sustainable.
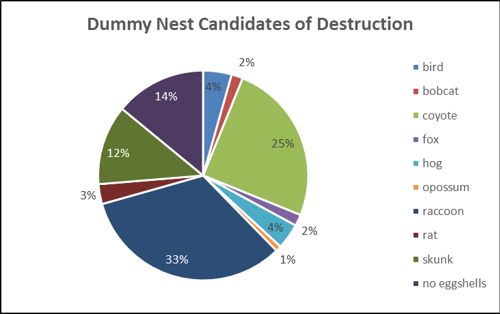
A breakdown of nest predators identified by eggshell evidence left at Texas Quail Index dummy nests
Cooperators are also asked to use eggshells and other evidence to identify the predators that have raided their dummy nests, if possible. Coyotes and raccoons have historically been some of the most commonly cited nest predators, and this year they were the alleged culprit in more than half (58%) of all depredation events. Others included skunks, bobcats, feral hogs, and various birds. There are always a number of cases where no evidence is left behind at all, making it difficult to speculate on the identity of the predator. It is tempting to attribute the lack of eggshells to snakes because they swallow the eggs whole when they feed, but a number of other predators—including hogs and birds—are capable of removing eggs from a nest without making a mess.
Game Cameras
Quail predators are also monitored by setting out game cameras in the summer. More than 200 predators of 15 different species were recorded this year, with hogs (count: 72) and coyotes (count 74) making up the vast majority. Both species are common throughout Texas, and the feral hog problem in particular has been an epidemic for quite some time, but these are also species which are more likely to make use of the roads where game cameras are typically placed. The camera and dummy nest evidence together can provide insight into the type and number of quail predators on a property.

A badger captured by a game camera. Photo courtesy of Cottle County
Habitat Evaluations
Cooperators conduct habitat evaluations by examining and scoring several aspects of quail habitat, from nesting and woody cover to the diversity and distribution of food resources. A score is calculated for the area overall which denotes it as “poor,” “fair,” “good,” or “excellent” habitat. The average score this year was 0.68, about on par with last year’s 0.69 and falling into the “good” category. There was huge variability among individual counties, with scores ranging from 0.52 to 0.89. Across the board, the primary limiting factors were nesting cover and diversity of woody cover species.
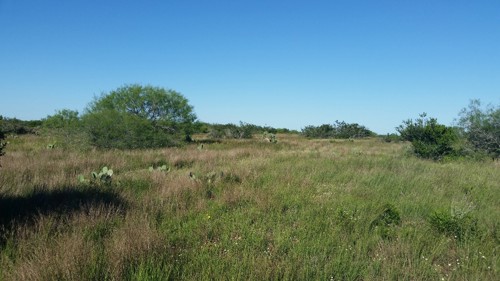
High quality bobwhite habitat. Photo courtesy of Amanda Gobeli
Roadside Counts
If spring call counts indicate the breeding capital of a quail population, then roadside counts, which take place in the fall, show the results of those reproductive efforts. TQI participants drive a 10-20 mile route across their cooperating property and record the number of birds seen, from which “quail per mile” is calculated. It usually serves as a decent indicator of the state of a quail population just prior to hunting season and winter. This year though, abundant August and September rains left many cooperators washed out, unable to complete all their counts and seeing far fewer birds than usual. The statewide average for bobwhites fell to 1.7, down from 5.7 in 2016. Scaled quail fared much better and in fact saw an increase in the average number of birds per mile this year (1.41) over 2016 (1.32).
There is one metric being reported that may cause concerns about this year’s quail crop. The ratio of juvenile to adult birds (J:A), identified by patterning on the primary covert feathers, can also indicate the degree and success of that season’s breeding activity. Although it is not required for the Quail Index, many hunters make note of it in the birds they bag. The Rolling Plains Quail Research Ranch captured 26% juveniles on its first trapping night this year for a J:A ratio of about 1:3, and hunters are reporting similar values. The boom and bust nature of quail populations means that the J:A ratio can fluctuate considerably from year to year and often lands below average, but the higher it is, the better shape a quail population is thought to be in, as it means more “young blood” was added to its ranks that year (Wilkins, 1999). High producing quail regions like the Rolling Plains and South Texas Plains average between 3 and 4 juveniles for every adult—the inverse of the ratios as they currently stand.
The Big Picture
While the values we are seeing now are lower than during the remarkable boom of 2 years ago, 2017 does not appear to be the bust that many expected it to be. Time and continued observation will tell if the disappointing roadside counts and J:A ratios are outliers or the precursors to a true bust in 2018, but the overall picture painted by the Texas Quail Index is that quail have managed to beat the odds by hanging on for a third straight year.
---
Literature Cited
Wilkins, N. (1999). Techniques for Estimating Quail Population Trends. In K.A. Cearley (Ed.), Preserving Texas’ Quail Heritage into the 21st Century: Proceedings of a Symposium (67-73).
Edited by Dr. Dale Rollins, Statewide Coordinator, Reversing the Quail Decline Initiative
--
Original article published with Texas A&M AgriLife Extension Wild Wonderings blog