

Texas Quail Index 2019 Summary
The numbers are in for this year’s Texas Quail Index, and the reigning sentiment across the state appears to be “a slight improvement over last year, but less than we’d hoped for.” It’s difficult not to feel disappointed with the red letter years of 2016 and 17 still fresh in the minds of many quail enthusiasts, but it looks like we’ll have to wait at least one more year before this bust really turns around. With that in mind, we can examine data from each of the Texas Quail Index demonstrations to see what has been going on with quail populations and habitat in 2019.
Our first demonstration, Spring Call Counts, occurs in April/May and measures breeding capital for our quail populations. The graph below depicts statewide averages for the number of roosters heard per data collection stop:
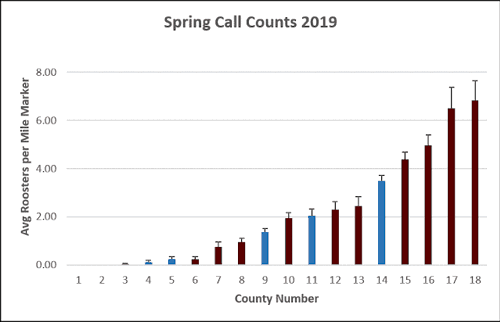
Statewide averages for number of roosters heard per mile marker, with burgundy bars representing bobwhite counts and blue bars representing scaled quail counts. Error bars are standard error of the mean.
What’s immediately clear is that there was a considerable range in results among counties, from 0 birds heard over the course of 3 separate counts up to nearly 6.5 birds per stop at the other end of the spectrum. While we saw much higher numbers in 2016, 6+ birds per stop is respectable. Our overall bobwhite quail average was 2.4 roosters per stop, lower than 2018’s 3.4. Scaled quail held steady with an average of 1.4 compared to last year’s 1.5. While several counties remained about on-par with the previous year’s results, there were few that showed significant improvements.
As we transition into summer, the TQI shifts its focus to quail habitat and resources, starting with the Dummy Nest exercise. Here cooperators use chicken eggs to simulate a quail nest and interpret eggshells and other evidence to identify nest predators. Dummy nest survival overall was much improved over last year, with an average survival rate of about 53% overall compared to 2018’s record low of 41%:
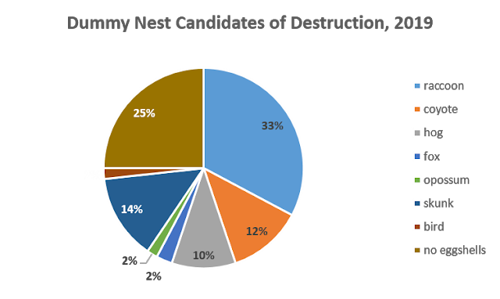
A breakdown of dummy nest predators identified by eggshell evidence.
Dummy nests aren’t the only method we use to study quail predators; game cameras are also set up around this time to definitively identify some of the predators present on the property.
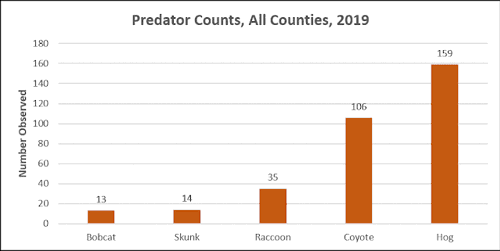
Total numbers of predators documented by game cameras, separated by species. Hogs/wild pigs and coyotes accounted for about 75% of observations.
This year’s game camera results can best be summarized as “hogs, coyotes, and everything else.” Those two species have always claimed the number 1 and 2 spots in the hierarchy of creatures photographed, largely because they are most likely to traverse the ranch roads where, for the sake of logistical simplicity, the cameras are often placed. However, the extent to which they dominated the field this year—accounting for about 75% of all observations—is surprising.
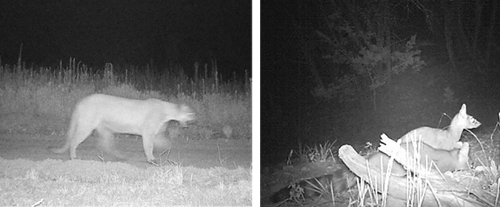
Wild pigs and coyotes weren’t the only animals photographed, however. Highlights included a mountain lion and two ring-tailed cats, pictured above.
The final summer demonstration for the TQI is habitat evaluations, in which cooperators conduct a standardized evaluation at each of their 8 study sites. These scores usually trend high and rarely fall below the “good” range on the rating scale, but it still helps us see how habitat features change from year to year.
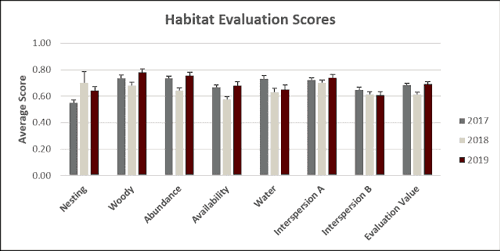
Average habitat evaluation scores for each habitat parameter as well as the overall Evaluation Value. Error bars are standard error of the mean.
It looks like most aspects of quail habitat improved in 2019, including the “Evaluation Value” which gauges habitat quality overall. This year’s statewide average EV was 0.69, which falls well within the “good” range and represents an improvement over last year’s record low of 0.62. The only features which scored lower this year were nesting cover and (barely) Interspersion B, a measure of the diversity of woody cover species.
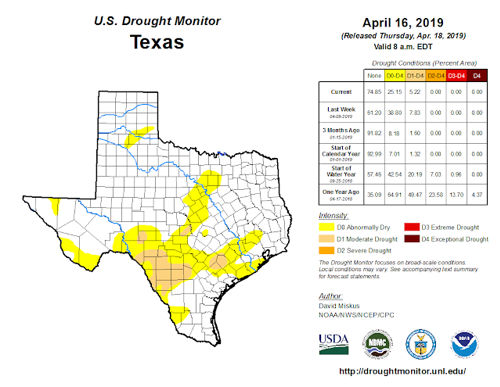
The U.S. Drought Monitor Texas map for April 16, 2019, indicating low-to-no drought conditions for much of the state.
The U.S. Drought Monitor can help us add some context to the Habitat Evaluation data. There’s no denying that 2019 was a rainy year; at the start of quail breeding season, many parts of the state were out of drought conditions entirely or at the first or second drought level. If nesting cover was slightly lower this year, it was probably because there were more moisture-rich, food producing forbs on the landscape, and that might be a good thing. It’s worth noting that 2018 was a rare year in which availability of food was identified as a limiting factor by TQI cooperators.
That brings us to the end of the year and the final demonstration of the Texas Quail Index: Roadside Counts.
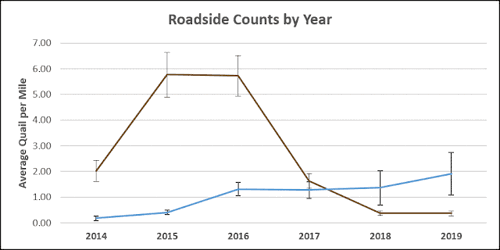
Roadside count results for bobwhites (brown line) and scaled quail (blue line). Error bars are standard error of the mean.
Recent Posts


June 23, 2025
Working Lands, Wildlife: A Wild Goose Chase Win


May 19, 2025